Persistence, stores and visualisation#
atomRDF graphs are backed by RDFLib stores, so the same KnowledgeGraph API can target an in-memory store (the default), an on-disk SQL-backed store, or a high-performance Oxigraph store.
This notebook covers:
Writing and re-loading a graph in Turtle / JSON-LD.
Choosing a store at construction time.
Visualising the graph in the notebook.
from atomrdf import KnowledgeGraph
import atomrdf.build as build
1. In-memory graph (the default)#
kg = KnowledgeGraph()
_ = build.bulk("Fe", cubic=True, graph=kg)
_ = build.bulk("Cu", cubic=True, graph=kg)
kg.n_samples
2
Write the graph to disk and round-trip it:
kg.write("demo.ttl", format="ttl")
kg2 = KnowledgeGraph(graph_file="demo.ttl")
kg2.n_samples
2
JSON-LD also works, which is often easier to consume from web tooling:
kg.write("demo.jsonld", format="json-ld")
2. Picking a different store#
atomRDF ships connectors for three stores. They are selected via the store argument:
from atomrdf import KnowledgeGraph

# Default in-process memory store:
kg = KnowledgeGraph(store="Memory")

# SQLAlchemy-backed (requires `pip install "atomrdf[sqlalchemy]"`):
kg = KnowledgeGraph(store="db", store_file="atomrdf.db")

# Oxigraph (requires `pip install "atomrdf[oxigraph]"`):
kg = KnowledgeGraph(store="Oxigraph", store_file="oxidir/")
All three stores expose the same Python API; pick the in-memory store for quick experiments and one of the persistent stores for long-running projects.
3. Visualising the graph#
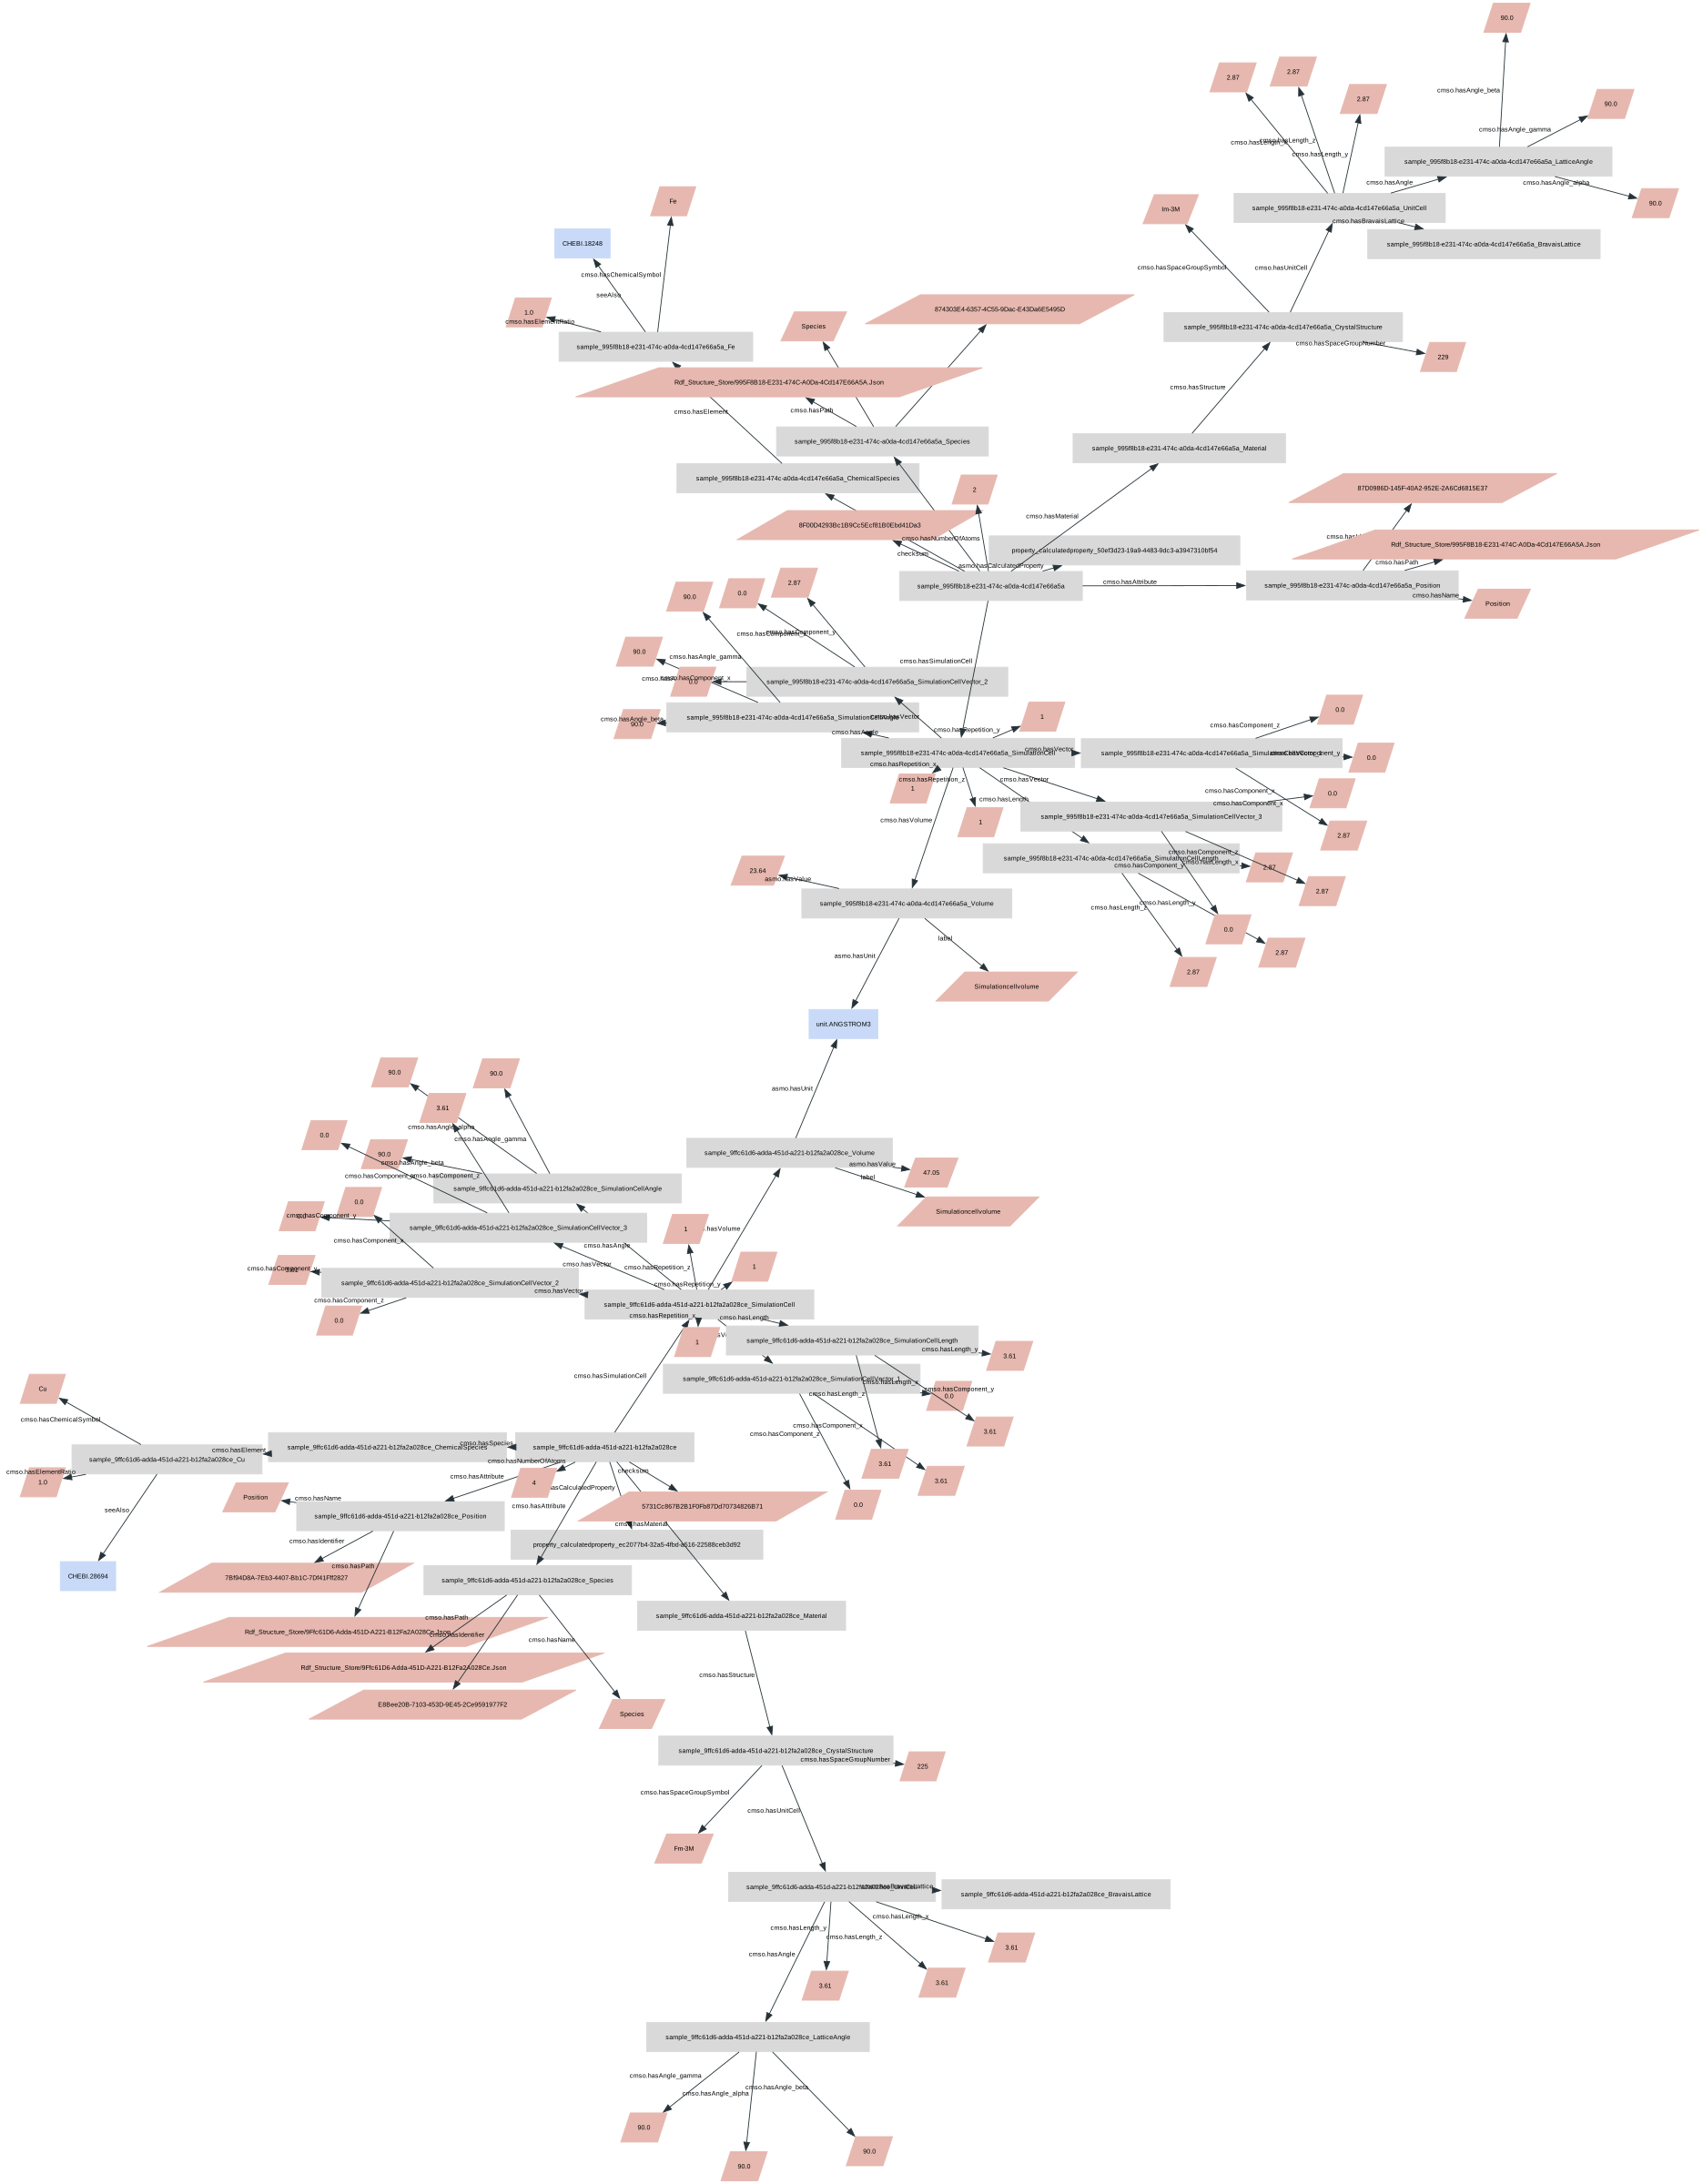
kg.visualise() renders the RDF graph inline using GraphViz. hide_types=True collapses rdf:type edges so only the data relationships remain.
kg.visualise(hide_types=True, size=(40, 25))
For very large graphs the inline view can become unwieldy; in that case export to a stand-alone HTML / SVG file and open it in a browser.